Independent of input sales
Recommendations follow the soil diagnosis, not a product catalogue.
Each result connects a diagnosis, an action and the same indicator measured again against a baseline and control.
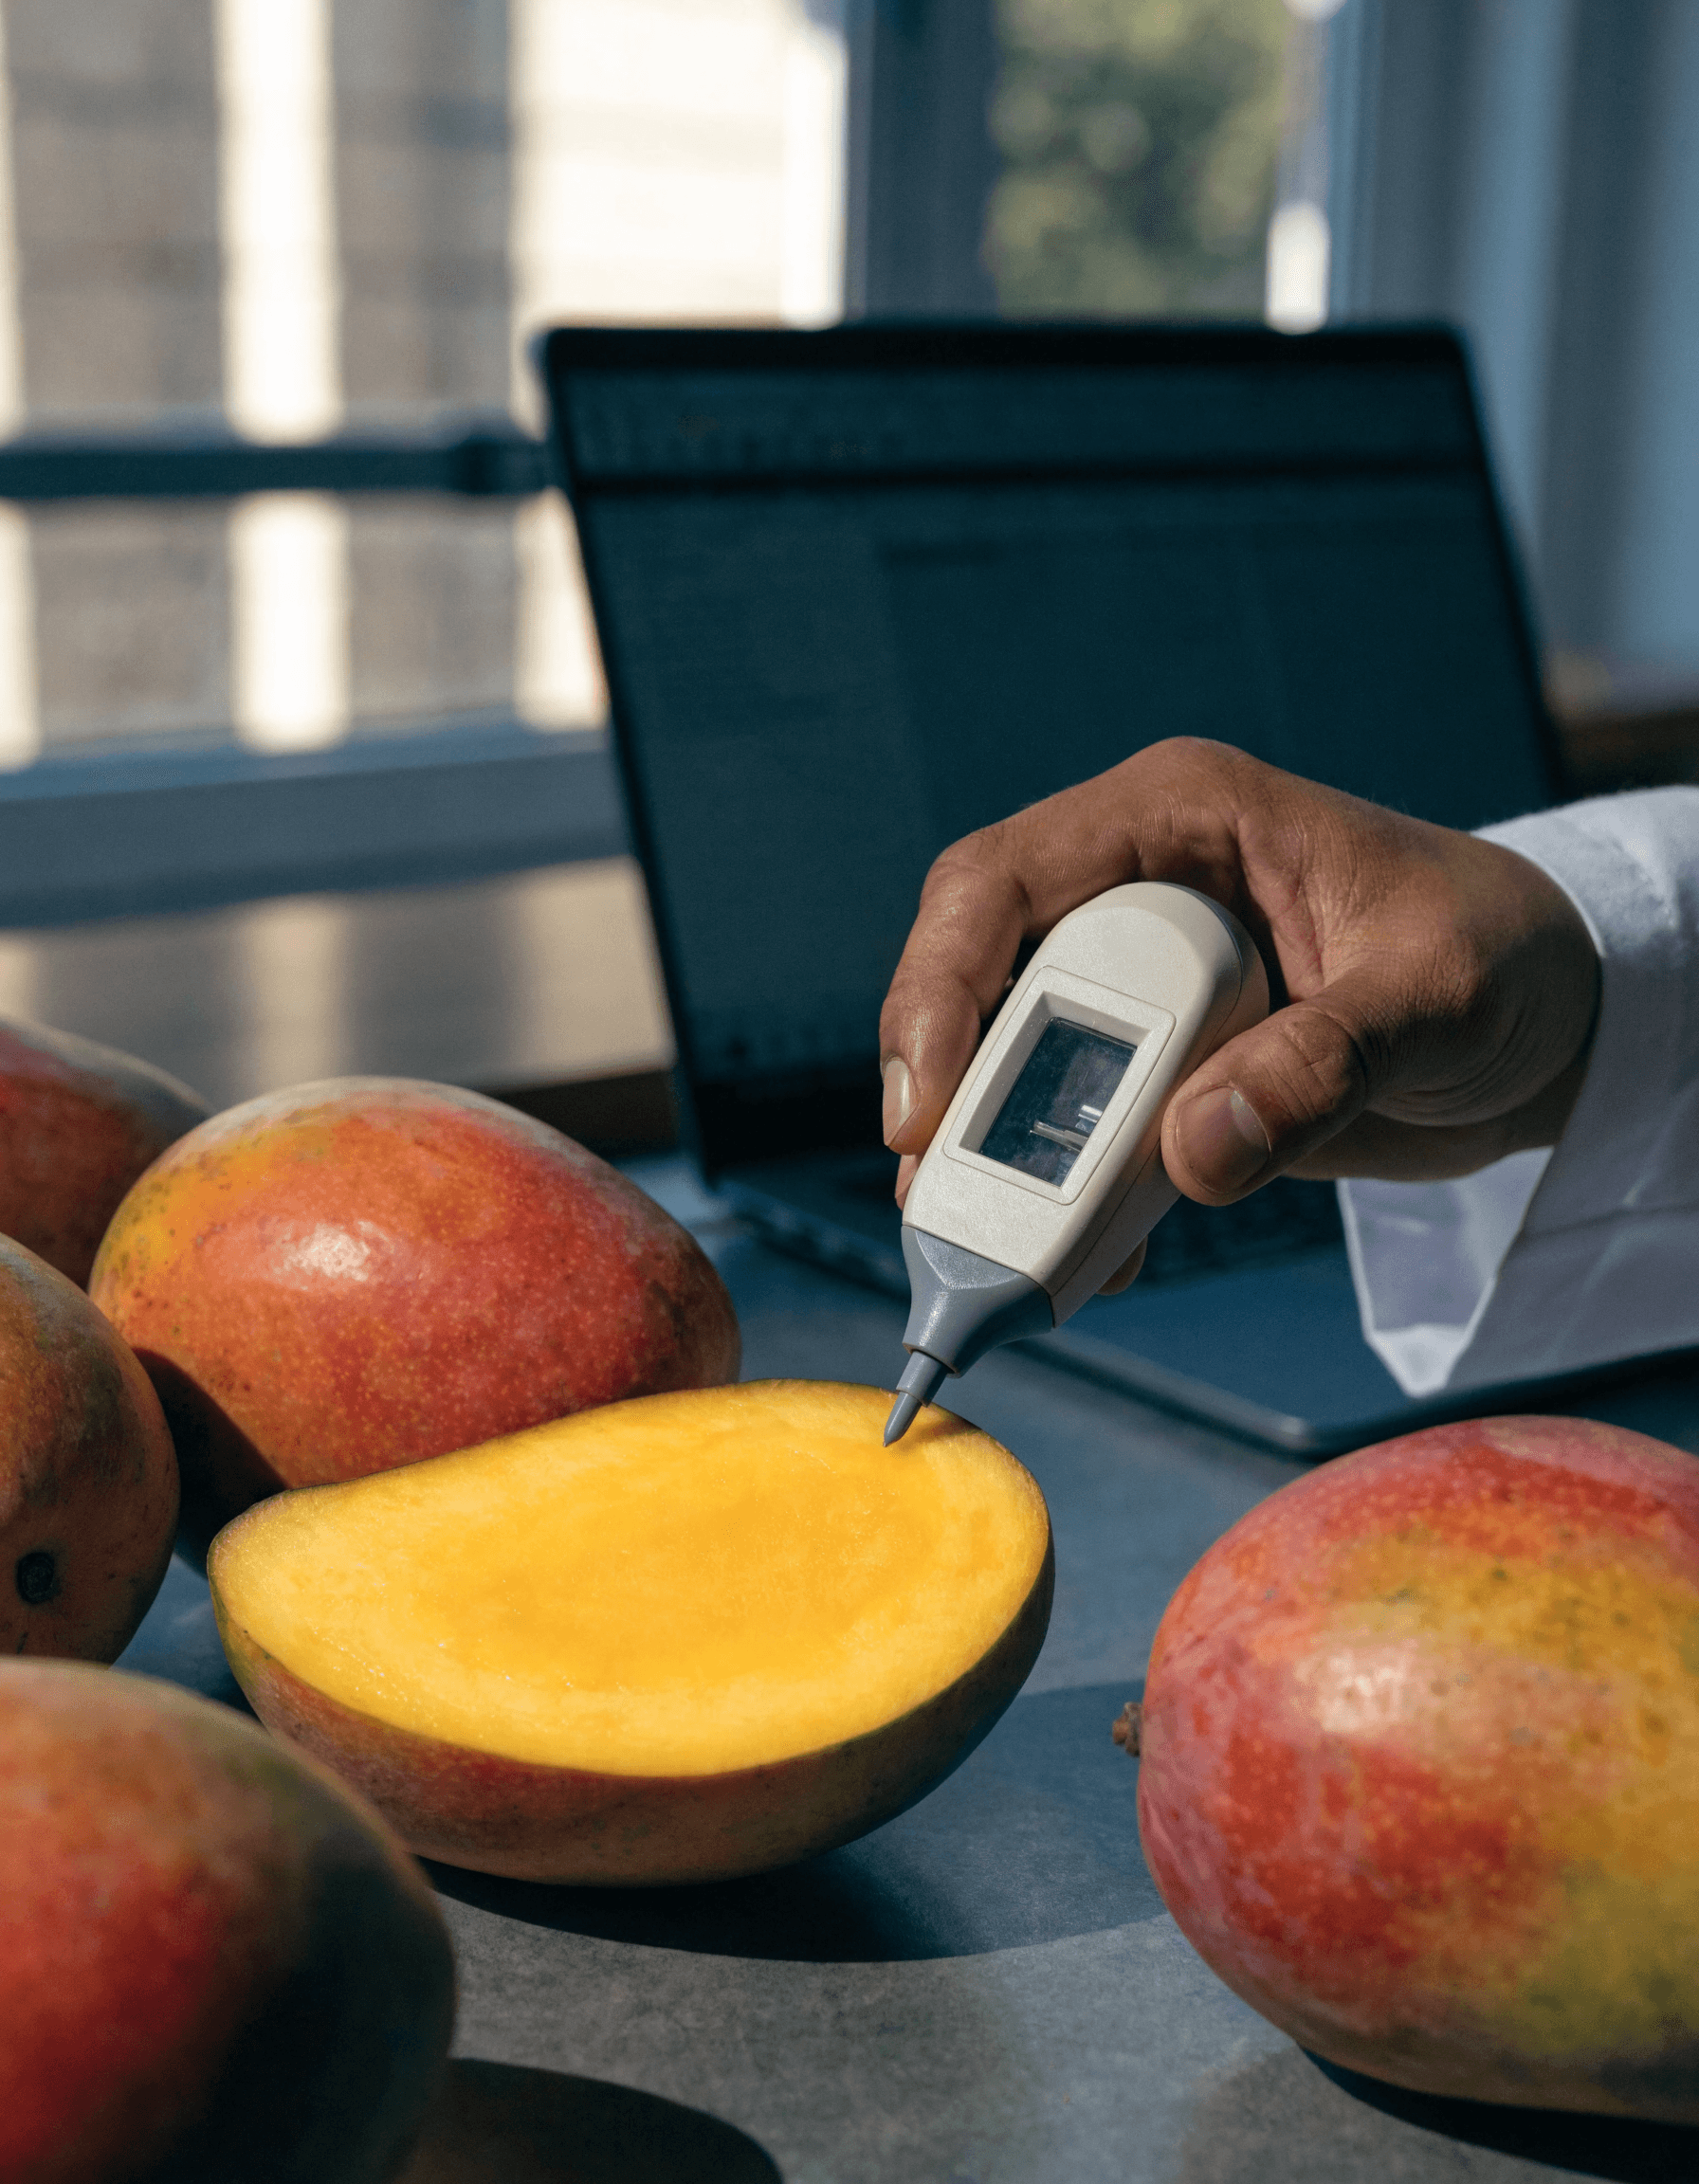
Evidence dashboard
Track the measures that actually change, then roll them up by supplier and region.
| Supplier | Region | Fertilizer/ton | Status | Progress |
|---|---|---|---|---|
| Finca La Esperanza Coffee | Huila | −34% | On track | |
| Cooperativa El Roble Coffee | Nariño | −21% | Correcting | |
| Huerta del Valle Avocado | Antioquia | −18% | Correcting |
Worked example
Every portfolio indicator begins with a soil diagnosis on a single farm.
Root cause: compacted, acidic topsoil is limiting nutrient uptake. Adding more fertilizer would not solve it.
Credible by design
The dashboard is useful only when the field data behind it can be checked.
Recommendations follow the soil diagnosis, not a product catalogue.
Supplier indicators refresh as pilots report new measurements.
Each result keeps its location, baseline, action and follow-up measurement together.
Choose a treated and control lot, agree the indicators and build the evidence over time.